Close

Recent Search Keywords

  • Finance
  • Idea
  • Service
  • Growth
  • Plan
Get a Free Consultation
  • Home
  • About Us
  • Service
    • Excel Expert Support
    • Excel Consulting
    • Excel Dashboard Creation & Maintenance
    • Custom Excel Spreadsheet
    • Excel for Reporting
    • Excel Automation
    • Data Analysis & Data Mining:
    • Advance Excel Formulas & Functions
  • Templates
  • Pricing
  • Blog
Get in Touch

Contact Info

  • Chicago 12, Melborne City, USA
  • +88 01682648101
  • info@example.com

CHARTS IN EXCEL

What is chart?

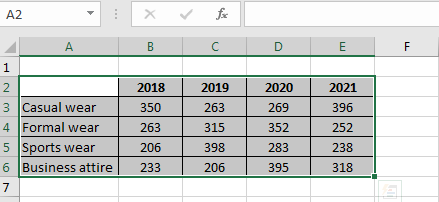
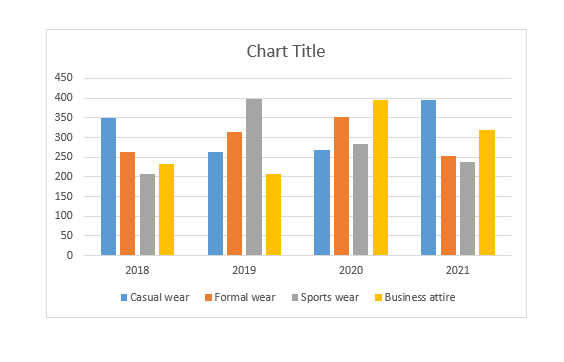
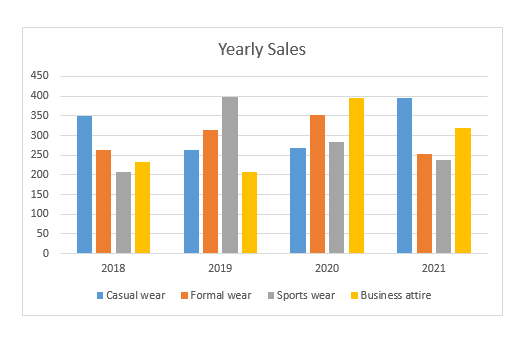
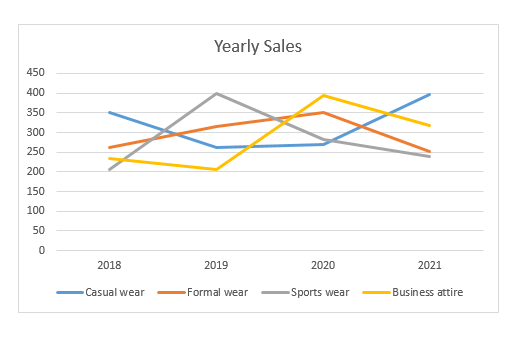
Graph is often called charts. Chart is a visual presentation of data from a worksheet. People can understand more about data than just looking at the numbers.

There are various types of charts available in excel such as Bar chart, Line chart, Pie chart, Hierarchy chart, Statistic chart, Scatter/Bubble chart, Waterfall/Stock chart, Combo chart, Surface/Radar chart etc.

Column A – Various types of clothes.

Column B to E – Sales of the year

For creation of chart first you have to select all data.
Go to the insert then select chart type.
Chart is created and look like this.
Then give title to the chart.
Line chart.
Scatter chart.

General

  • About Us
  • Services
  • Pricing
  • Contact Us

Services

  • Excel Expert Support
  • Excel Consulting
  • Excel Dashboard Creation & Maintenance
  • Custom Excel Spreadsheet

Contact

  • (+91) 72290 50607
  • info@exceltechsolution.com

Copyright © 2023 Exceltech Global Outsourcing Pvt. Ltd, All Rights Reserved.

  • Privacy Policy
  • Terms & Conditions